
Trajectories for impacts of re-vegetation activities on upland blanket bogs
A report on 12 years of research on the impacts of re-vegetation
Since 2003, our frequent and detailed surveys show the effect of conservation actions on the developing vegetative community.
A detailed report was written in 2016. You can find links to the report and its 5 annexes at the bottom of this page.
Read the report
The report explains the results of these surveys. It details the changes to vegetation over time as a result of our work, as well as the knock on effects of this work in regard to outcomes such as the flow of water during a storm event, the water quality flowing from the sites, water table heights and sediment accumulation.
The research found that:
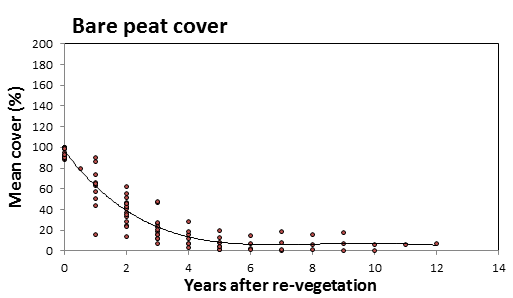
- The extent of bare peat reduced at a linear rate for 5 years
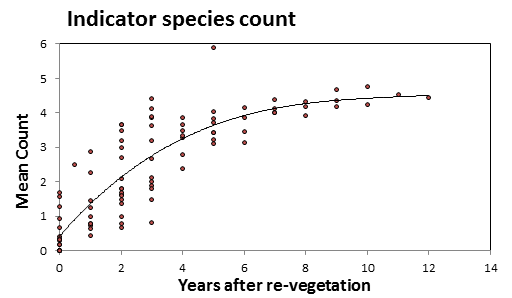
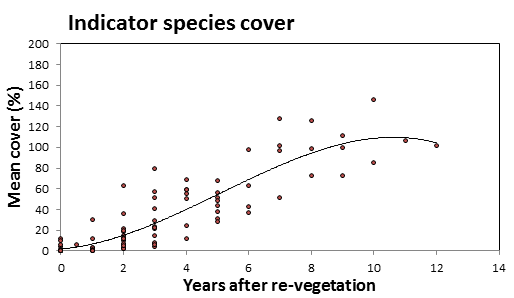
- The cover and number of indicator species improved over the whole 12 years
- Water table height increased steadily over 12 years
- A strong correlation between cover of indicator species and height of water table was observed
- Storm flow lag times (between peak rain input and peak flow output) increased dramatically in the first year
- The amount of peak storm flow decreased dramatically in the first year
- Concentrations of calcium (a major component of the lime treatment) were significantly raised and were still high 18 months later
- pH was also raised
- Annual mean concentrations of dissolved organic carbon did not change
- Gully blocks successfully trapped sediment during the first two years after installation
An article based on this research has been published in the journal Science of the Total Environment
Read the summary report to find out more or delve into 5 Annex papers.
Trajectories for impacts of revegetation summary report MoorLIFE2020 | 2016
Trajectories for impacts of revegetation activities on upland blanket bogs.
Trajectories for impacts of revegetation Annex 1 Vegetation MoorLIFE2020 | 2016
Trajectories for impacts of revegetation activities on upland blanket bogs.
Trajectories for impacts of revegetation Annex 2 Water Table MoorLIFE2020 | 2016
Trajectories for impacts of revegetation activities on upland blanket bogs
Trajectories for impacts of revegetation Annex 3 Water Flow MoorLIFE2020 | 2016
Trajectories for impacts of revegetation activities on upland blanket bogs.
Trajectories for impacts of revegetation Annex 4 Water Quality MoorLIFE2020 | 2016
Trajectories for impacts of revegetation activities on upland blanket bogs.
Trajectories for impacts of revegetation Annex 5 Sediment Accumulation MoorLIFE2020 | 2016
Trajectories for impacts of revegetation activities on upland blanket bogs.
Funded by
![]()
![]()